JANUARY CANADIAN HOME SALES IMPROVE
 Statistics released today by the Canadian Real Estate Association (CREA) show that national home sales improved in January, climbing 3.6% from December ’18 to January ’19. Last year’s annual sales were the weakest since 2012.
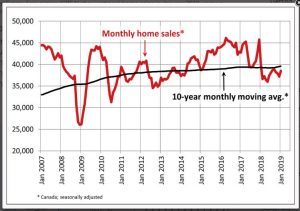
As the chart below shows, national monthly home sales remain below their 10-year moving average and are decidedly lower than in the boom years of 2016 and 2017. Households are still adjusting to the tightened mortgage qualification rules introduced in January 2018. The number of homes trading hands was up from the previous month in half of all local markets, led by Montreal, Ottawa and Winnipeg.
Actual (not seasonally adjusted) sales were down 4% from year-ago levels and posted the weakest January since 2015. Year-over-year (y/y) sales were below the 10-year average for January on a national basis and in British Columbia, Alberta, Saskatchewan, Ontario and Newfoundland & Labrador.
Housing market conditions remain weakest in the Prairie region, and the Lower Mainland of B.C. Housing has been more fragile than the Bank of Canada expected, notwithstanding the tighter mortgage regulations combined with previous actions by provincial governments and CMHC to slow housing activity. The slowdown in housing has contributed meaningfully to the weakness in Canadian economic activity.
New Listings
The number of newly listed homes edged up 1% in January, led by a jump in new supply in Greater Vancouver and Hamilton-Burlington.
With sales up by more than new listings, the national sales-to-new listings ratio tightened to 56.7% compared to 55.3% posted in December. This measure of market balance has remained close to its long-term average of 53.5% for the last year.
Based on a comparison of the sales-to-new listings ratio with the long-term average, more than half of all local markets were in balanced market territory in January 2019.
There were 5.3 months of inventory on a national basis at the end of January 2019, in line with its long-term average. That said, the well-balanced national reading masks significant regional differences. The number of months of inventory has swollen far above its long-term average in Prairie provinces and Newfoundland & Labrador; as a result, homebuyers there have an ample choice of listings available for purchase. By contrast, the measure remains well below its long-term average in Ontario and Prince Edward Island, consistent with seller’s market conditions. In other provinces, sales and inventory are more balanced.
Home Prices
The Aggregate Composite MLS® Home Price Index (MLS® HPI) was up 0.8% y/y in January 2019 – the smallest increase since June 2018.
Following a well-established pattern, condo apartment units recorded the largest y/y price increase in January (+3.3%), followed by townhouse/row units (+1.5%). By comparison, two-storey single-family home prices were little changed (+0.1%) while one-storey single-family home prices edged down (-1.1%).
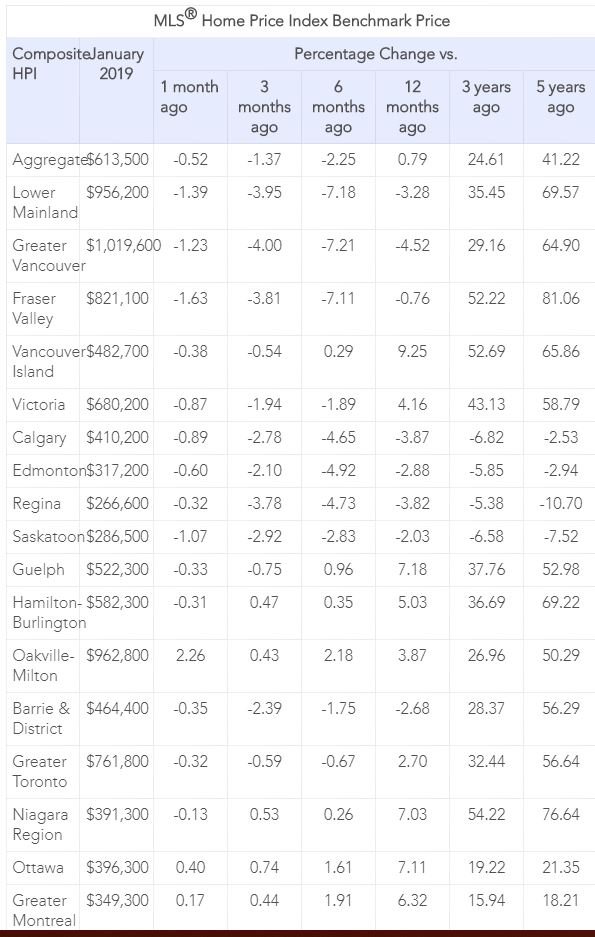
Trends continue to vary widely among the 17 housing markets tracked by the MLS® HPI. Results were mixed in British Columbia. Prices were down on a y/y basis in Greater Vancouver (-4.5%) and the Fraser Valley (-0.8%). By contrast, prices posted a y/y increase of 4.2% in Victoria and were up 9.3% elsewhere on Vancouver Island.
Among housing markets tracked by the index in the Greater Golden Horseshoe region, MLS® HPI benchmark home prices were up from year-ago levels in Guelph (+6.8%), the Niagara Region (+6.8%), Hamilton-Burlington (+6.4%), Oakville-Milton (+3.3%) and the GTA (+3%). Home prices in Barrie and District remain slightly below year-ago levels (-1.1%).
Among Greater Golden Horseshoe housing markets tracked by the index, MLS® HPI benchmark home prices were up from year-ago levels in Guelph (+7.2%), the Niagara Region (+7%), Hamilton-Burlington (+5%), Oakville-Milton (+3.9%) and the GTA (+2.7%). By contrast, home prices in Barrie and District remain below year-ago levels (-2.7%).
Across the Prairies, supply is historically elevated relative to sales, causing benchmark home prices to remain down from year-ago levels in Calgary (-3.9%), Edmonton (-2.9%), Regina (-3.8%) and Saskatoon (-2%). The home pricing environment will likely remain weak in these cities until elevated supply is reduced.
Home prices rose 7.1% y/y in Ottawa (led by a 9.5% increase in townhouse/row unit prices), 6.3% in Greater Montreal (led by a 9.2% increase in townhouse/row unit prices) and 1% in Greater Moncton (led by a 15.1% increase in townhouse/row unit prices). (see Table 1 below).
Bottom Line
The Bank of Canada meets again on March 6th and it is highly unlikely they will hike interest rates. The Canadian economy has been burdened with a weakened oil sector, reduced trade and a weak housing market. Although job growth has been stronger than expected, wage gains have moderated and inflation pressures are muted.
We are likely in store for a prolonged period of modest housing gains in the Greater Golden Horseshoe, stability or softening in much of British Columbia and further weakening in the Prairies, Alberta, and Newfoundland & Labrador.
Sluggish sales and modestly rising prices nationally are likely in prospect for 2019. While there will still be some significant regional divergences, there is no need for further policy actions to affect demand. Indeed, a growing chorus has been calling for lowering the mortgage qualification rate from the posted five-year fixed rate, currently 5.34%, to closer to the actual conventional rate, about 200 basis points lower.


